What would improve the case?
Cement volume growth and sustained cash generation; recovery in BUA Foods revenue.
Did the historical winner remain the better performer?
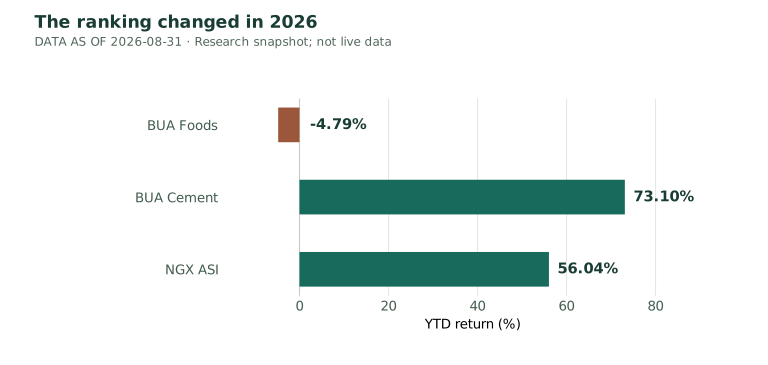
| Metric | BUA Foods | BUA Cement | NGX ASI |
|---|---|---|---|
| YTD return | −4.79% | 73.1% | 56.04% |
| Annualized volatility | 28.4% | 50.0% | 15.1% |
| Maximum drawdown | −21.3% | −40.0% | −11.0% |
Cement volume growth and sustained cash generation; recovery in BUA Foods revenue.
Naira and input costs; margin normalisation; cement capital spending and high stock volatility.
My Python comparisons, financial analysis, portfolio exercise and research interpretation.
Market data: 1 January–31 August 2026. Financials: 2022–2025 and H1 2026 vs H1 2025. Source: my BUA notebook and financial comparison. Returns and volatility are different measures; the volatility figures are annualized. Historical two-stock portfolio weights are in-sample results, not a diversified allocation recommendation.
Risk-free assumption: 17.13% annual assumption in the original notebook; not a verified current T-bill quote.
Sources and common conventions →The portable notebook reviews the dated summary inputs offline. The linked original repository contains the full workflow.