Research portfolio A–Z Equity Research Six completed research projects, each kept at its original cutoff. These are dated research snapshots, not live market updates.
A–Z / A · Global equities DATA AS OF 2026-08-26
Alphabet Is growth translating into cash for shareholders?
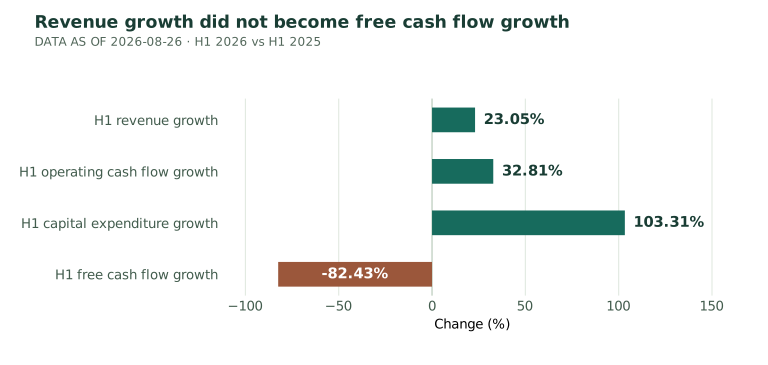
Key finding H1 revenue rose 23.05%, but free cash flow fell 82.43% as capital expenditure doubled.
Python Financial statements Cash conversion
Research & Python analysis by Olalekan Akinola
A–Z / B · Nigerian equities DATA AS OF 2026-08-31
BUA Foods / BUA Cement Did the historical winner remain the better performer?
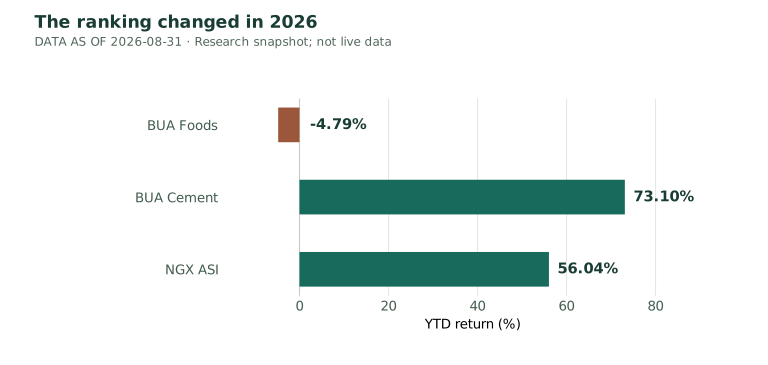
Key finding BUA Cement gained 73.1% YTD versus −4.79% for BUA Foods, but with about 50% annualized volatility.
Python Peer comparison Portfolio analytics
Research & Python analysis by Olalekan Akinola
A–Z / C · Global equities DATA AS OF 2026-09-04
CrowdStrike Did outperformance compensate for the size of the drawdowns?
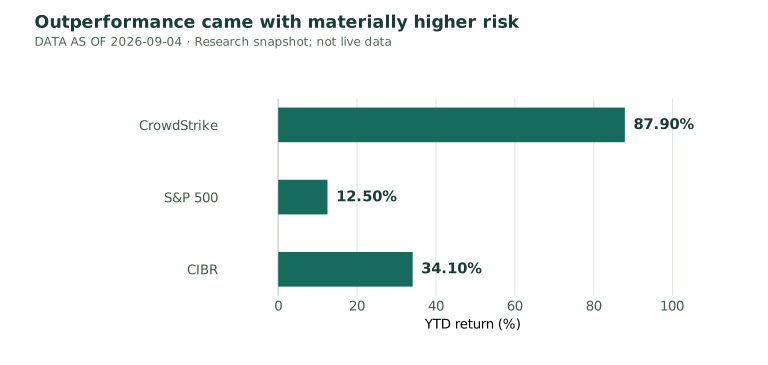
Key finding CrowdStrike returned 87.9% YTD, with 60.3% annualized volatility and a 26.8% maximum drawdown.
Python Sector benchmarking Drawdown analysis
Research & Python analysis by Olalekan Akinola
A–Z / D · Nigerian equities DATA AS OF 2026-09-18
Dangote Cement Was the rally stronger than the peer and index alternatives?
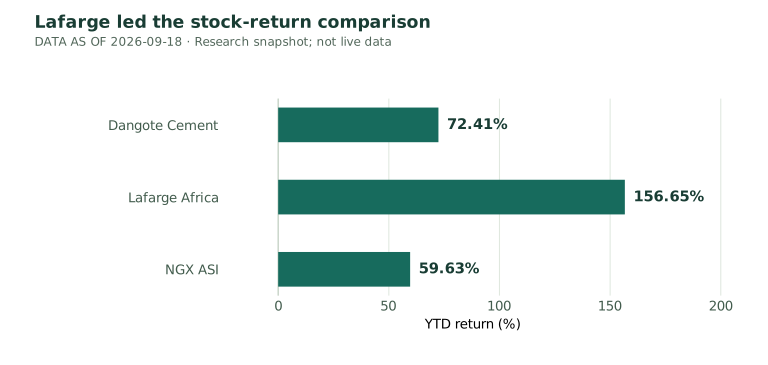
Key finding Dangote gained 72.41%; Lafarge gained 156.65%. The NGX ASI had the strongest recalculated annualized Sharpe estimate.
Python Collaborative research Risk analytics
Collaborative research · roles credited in case study
A–Z / E · Global equities DATA AS OF 2026-10-02
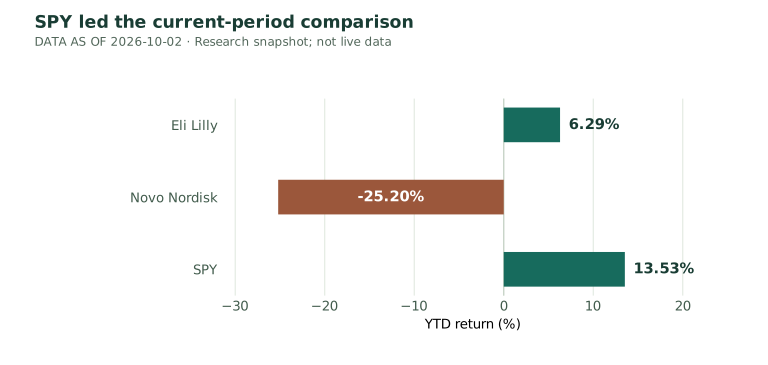
Eli Lilly Did business growth translate into stock outperformance?
Key finding Lilly returned 6.29% YTD versus SPY’s 13.53%, with substantially higher annualized volatility.
Python Collaborative research Sharpe / Sortino
Collaborative research · roles credited in case study
A–Z / F · Global equities DATA AS OF 2026-10-09
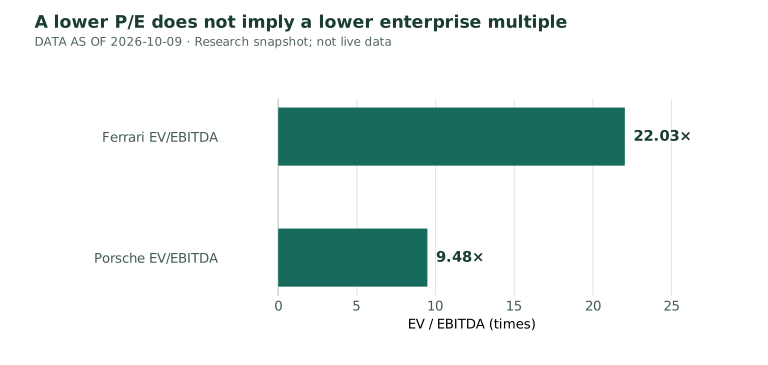
Ferrari Does business quality justify the valuation premium?
Key finding 22.03× EV/EBITDA versus Porsche’s 9.48×: the €144.29 peer scenario shows dependence on retaining a premium.
Python Excel comps ROIC / WACC
Research & Python analysis by Olalekan Akinola