What would improve the case?
Capacity utilisation, profitable volume growth, lower financing costs and improving free cash flow.
Was the rally stronger than the peer and index alternatives?
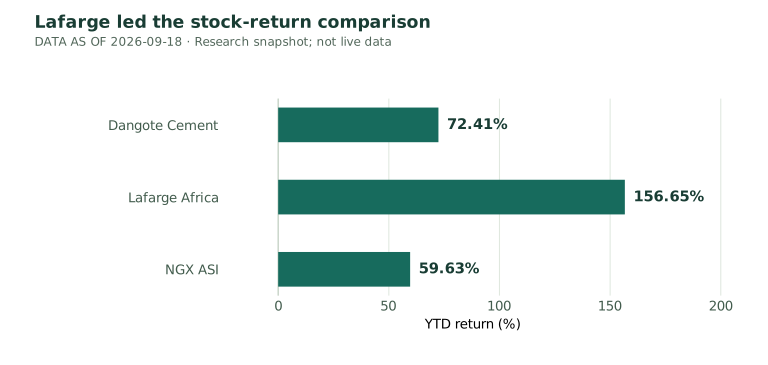
| Metric | Dangote | Lafarge | NGX ASI |
|---|---|---|---|
| YTD return | 72.41% | 156.65% | 59.63% |
| Annualized volatility | 35.74% | 45.78% | 14.78% |
| Annualized Sharpe estimate | 1.8925 | 2.8144 | 3.4752 |
| Maximum drawdown | −24.49% | −17.14% | −11.16% |
| 95% one-observation VaR | 0.77% | 4.01% | 1.08% |
| 95% conditional tail mean (CVaR) | 4.76% | 5.85% | 1.43% |
| Return observations | 176 | 176 | 176 |
Recomputed 29 October 2026 from the uploaded exports; 176 returns per series after the holiday correction. Sharpe figures: 16.75% fixed annual risk-free assumption; 252-day arithmetic mean / volatility annualization; 2 January–18 September 2026 (about 8.5 months). No serial-correlation adjustment. Audit details →
Dangote’s 95% VaR is 0.77%, but CVaR is 4.76% because 138 of 176 daily returns are zero and the nine worst observations contain much larger losses, including a 10% fall.
The original 0.74% VaR is reproducible before cleaning. Excluding 28 May changes the interpolated percentile to 0.77%; the nine tail losses and their 4.76% average do not change. Unchanged closes do not establish that there was no trading.
| H1 metric | 2025 | 2026 |
|---|---|---|
| Revenue (NGN bn) | 2,071.9 | 2,514.0 |
| Operating margin | 39.15% | 42.16% |
| Operating cash flow (NGN bn) | 874.3 | 1,056.0 |
| Capital expenditure (NGN bn) | 166.3 | 354.2 |
My Python analysis uses the project’s financial tables, with fundamental and financial analysis contributed by Oluwasegun Akinsanya.
Capacity utilisation, profitable volume growth, lower financing costs and improving free cash flow.
Energy and FX costs, heavy capital spending, stock liquidity and historical drawdowns.
My contribution: Python market/risk analytics, visualisation and interpretation. Oluwasegun Akinsanya contributed the fundamental and financial analysis. This is a collaborative research project.
2 January–18 September 2026 (about 8.5 months), 176 daily returns per series. Recomputed from the supplied CSV exports after excluding Dangote’s 28 May non-trading holiday row. No missing prices filled. Sharpe = (mean daily simple return × 252 − 0.1675) / (sample daily standard deviation × √252), without serial-correlation adjustment. The 16.75% annual risk-free assumption has no recorded source date. These are price returns, without a separate dividend adjustment. Dangote’s 95% VaR is 0.77%, but CVaR is 4.76% because 138 of 176 daily returns are zero and the nine worst observations contain much larger losses, including a 10% fall.
Recomputed 29 October 2026 from the uploaded exports; 176 returns per series after the holiday correction. Risk-free assumption: 16.75% fixed annual assumption in notebook cell 79; source observation date is not recorded.
Sources and common conventions →The portable notebook reviews the dated summary inputs offline. The linked original repository contains the full workflow.