What would improve the case?
Product demand, manufacturing capacity and sustained profitability and cash generation.
Did business growth translate into stock outperformance?
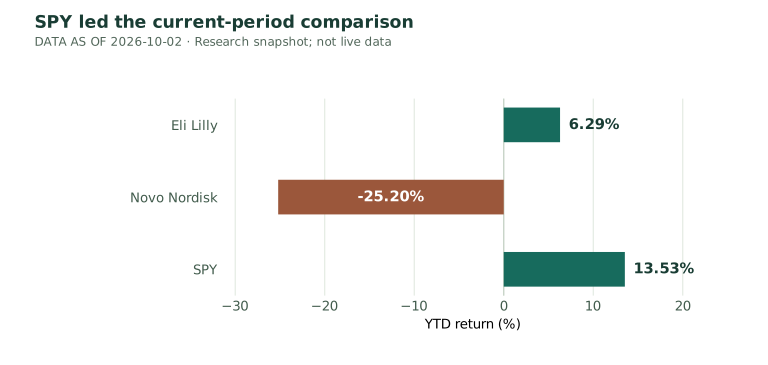
| Metric | Lilly | Novo | SPY |
|---|---|---|---|
| YTD return | 6.29% | −25.20% | 13.53% |
| Lilly / SPY annualized volatility | 36.87% | n/a | 13.15% |
Product demand, manufacturing capacity and sustained profitability and cash generation.
Competition, regulatory and pricing pressure, execution and valuation sensitivity.
My contribution: Python analytics, financial-performance charts and interpretation. Oluwasegun Akinsanya contributed the fundamental and financial analysis.
YTD through 2 October 2026. Historical window: January 2020–December 2025. SPY is the market proxy. The notebook uses 3.78% for YTD risk-free input, correcting the rounded 3.80% in the earlier narrative. Monte Carlo uses 10,000 paths over 252 trading days and does not produce a target price.
Risk-free assumption: 2.86% historical; 3.78% YTD annual assumptions in the notebook, using a 3-month US Treasury proxy.
Sources and common conventions →The portable notebook reviews the dated summary inputs offline. The linked original repository contains the full workflow.